Getting to know the user interface
The user interface consists of three pages: 1) the Homepage, 2) the Sensor Data page and 3) the Help page.
Due to the modular design, sensor configuration is optional. Corresponding indices and sensor data are displayed only in the corresponding configuration. If the corresponding sensor is not configured, the index and data are hidden or grayed out. For more details, please check Sensor Configurations.
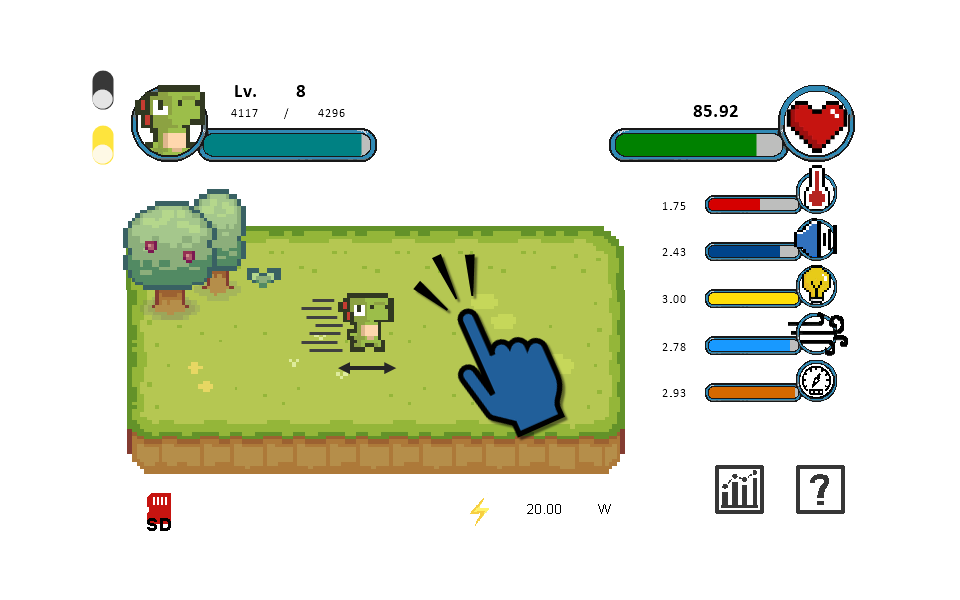
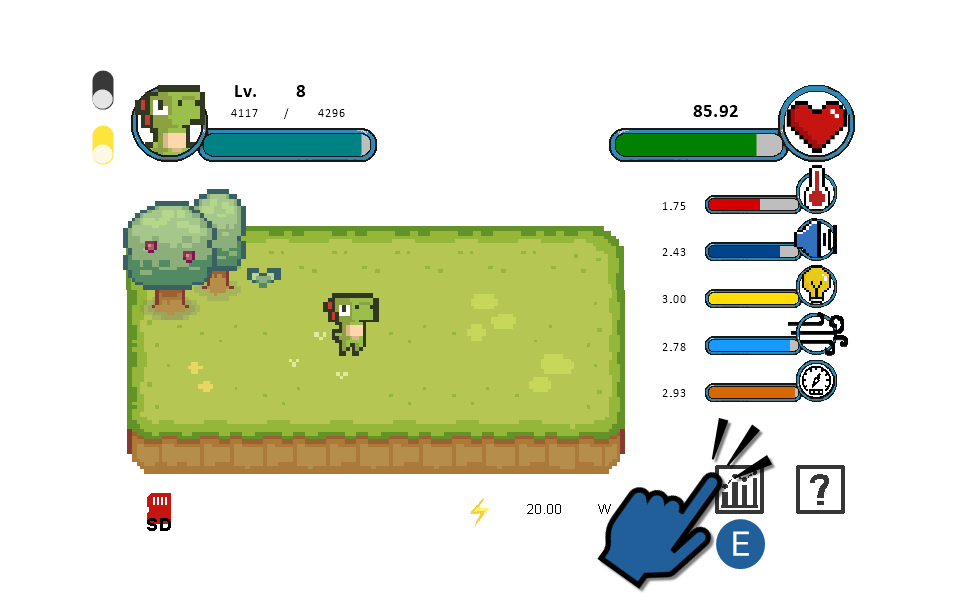
1. Homepage
(Click on the arrows to view the next slide)
(A) Show/hide buttons for numbers
(B) Enable/disable low brightness mode
(C) Dino’s status bar
(D) Current environment/comfort indices
(E) Sensor Data page
(F) Help page
(G) Error message area
(1) Dino’s current level
(2) Dino’s current experience points
(3) Experience points required to reach the next level
(4) Current Indoor Environmental Quality Index (IEQI)
(5) Current Thermal Comfort Index (TCI)
(6) Current Sound Comfort Index (SCI)
(7) Current Lighting Comfort Index (LCI)
(8) Current Indoor Air Quality Index (IAQI)
(9) Current Barometric Pressure Comfort Index (PCI)
(10) Current electrical power
The following is a description of all environment/comfort indices and error messages:

Current Indoor Environmental Quality Index (IEQI)
IEQI is evaluated by the following separate indices.
The range of IEQI is 0 – 100, with 0 being the worst and 100 being the best:
- 90 ~ 100: very good / very comfortable
- 66 ~ 90: good / comfortable
- 33 ~ 66: bad / uncomfortable
- 0 ~ 33: extremely bad / extremely uncomfortable
Dino can gain more experience points in a better environment with higher IEQI!

Thermal Comfort Index (TCI)
Based on Fanger’s PMV model (ISO 7730).
Range: 0 – 3, with 0 being worst and 3 being best. Results in the range from -3 to +3 of PMV model were taken as absolute values.

Sound Comfort Index (SCI)
Based on CEN/EN 16798-1 (german version DIN EN 16798-1) and WHO-ITU standard.
Range: 0 – 3, with 0 being worst and 3 being best.

Lighting Comfort Index (LCI)
Based on CEN/EN 16798-1 (german version DIN EN 16798-1).
Range: 0 – 3, with 0 being worst and 3 being best.

Indoor Air Quality Index (IAQI)
Based on EPA-454/B-06-001 guideline and CEN/EN 16798-1 (german version DIN EN 16798-1) standard.
Range: 0 – 3, with 0 being worst and 3 being best.
Note: when using CO2 sensors only, even if CO2 concentration is at a low level (e.g. < 1000 ppm), it does not fully imply that the air quality is necessarily good. CO2 is only used as an indirect index to reflect the ventilation situation. When using multiple gas sensors at the same time, such as CO2 and VOC sensors, the IAQI is the average of the respective indices.

Barometric Pressure Comfort Index (PCI)
For reference only.
Range: 0 – 3, with 0 being worst and 3 being best.
Note: there is still controversy about the effect of barometric pressure on comfort etc.

Electrical power
The electrical power measured by the power sensor with the unit Watt.
Note: This power is not the electrical power of the Ressourcenwächter itself, but the electrical power of the device/line measured by the power sensor. The default voltage is 230 volts.

Error Message – Real Time Clocker
RTC module not found, or initialization failed. Please check your hardware!
The possible reasons are as follows:
- Bad connection between RTC module and Microcontroller.
- RTC module battery needs to be replaced.
- RTC module is damaged.

Error Message – SD card
SD card not found, or initialization failed. Please check your hardware!
The possible reasons are as follows:
- The SD card is not formatted correctly, which may be caused by a power failure while writing data. When this occurs, connect the SD card to your computer, back up all data in it, and reformat the SD card. For a detailed guide, please see: Formatting the SD card.
- Bad connection between SD card module and microcontroller.
- SD card type is not supported. Only FAT16/32 file systems on standard SD cards and SDHC cards with capacities up to 32GB are supported.
- SD card is damaged.
- SD card module is damaged.
2. Sensor Data page

(F) Help page
(H) Homepage
(I) The grayed out data (If the corresponding sensor is not configured)
(4) Current Indoor Environmental Quality Index (IEQI)
(5) Current Thermal Comfort Index (TCI)
(6) Current Sound Comfort Index (SCI)
(7) Current Lighting Comfort Index (LCI)
(8) Current Indoor Air Quality Index (IAQI)
(9) Current Barometric Pressure Comfort Index (PCI)
(10) Current electrical power from power sensor
(11) Midpoint voltage of the power sensor
(12) Used SD card capacity
(13) SD card status
(14) Window status from window sensor
(15) Current date and time from RTC module
3. Help page

(H) Homepage
(J) Information about version and authorship
(K) QR code and web address to wiki page

“Pomodoro Mode”
Enable automatic feedback on “Homepage” every 30 minutes, following the Pomodoro time management principle.


